
Your AI data team
Put an AI data team on every business question.
Model your data, find out what changed, forecast what comes next, and build the charts and dashboards your team and customers use — on your data, inside your permissions.
Why InfuseBI
Dashboards show what happened. Your team still has to prepare the data, ask why, plan what comes next, and share the answer. InfuseBI gives you an AI data team for every one of those jobs — using your data, inside your permissions, with work you can review before anyone acts on it.
Meet your AI data team
From raw tables to the dashboard your customers use.
For the data team
Data Modeler
Pick the tables. It links them, names the fields, and suggests the measures, then checks the result before anyone uses it.
For finance and operations
Analyst
Ask why a number moved. It splits the change into drivers and shows the evidence behind every figure.
For planning
Data Scientist
Forecasts, segments, and models with an honest range, and a method you can open and check.
For everyday reporting
Composer
Ask for a chart, pivot, or report and get it straight from governed data.
For leadership
Dashboard Agent
One prompt drafts a complete dashboard. Nothing is published until you review it.
For a polished finish
Designer
Restyle charts and dashboards in plain words: colours, labels, formats, and layout.
For SaaS and customer portals
Inside your product
Put the same work inside your app or portal. Each customer sees only their own data.
What your AI data team can do
Eight ways your AI data team puts data to work.
- 01Prepare
Model your data with AI
Pick the tables. AI links them and suggests the measures, with no SQL. Every change is checked before it goes live.
Learn more about prepare - 02Investigate
Find out why a number moved
Break a change into the drivers behind it — product, region, price, volume, returns — with the evidence attached.
Learn more about investigate - 03Forecast
Plan with an honest range
Project demand or revenue with uncertainty bands, and compare the model against a simpler challenger before you trust it.
Learn more about forecast - 04Segment
See who behaves differently
Group customers by frequency, value, and behaviour, then explain what sets each segment apart.
Learn more about segment - 05Model
Go as deep as the question needs
Regression, classification, clustering, and anomaly detection — with notebooks and output files you can inspect.
Learn more about model - 06Publish
Share work people can use
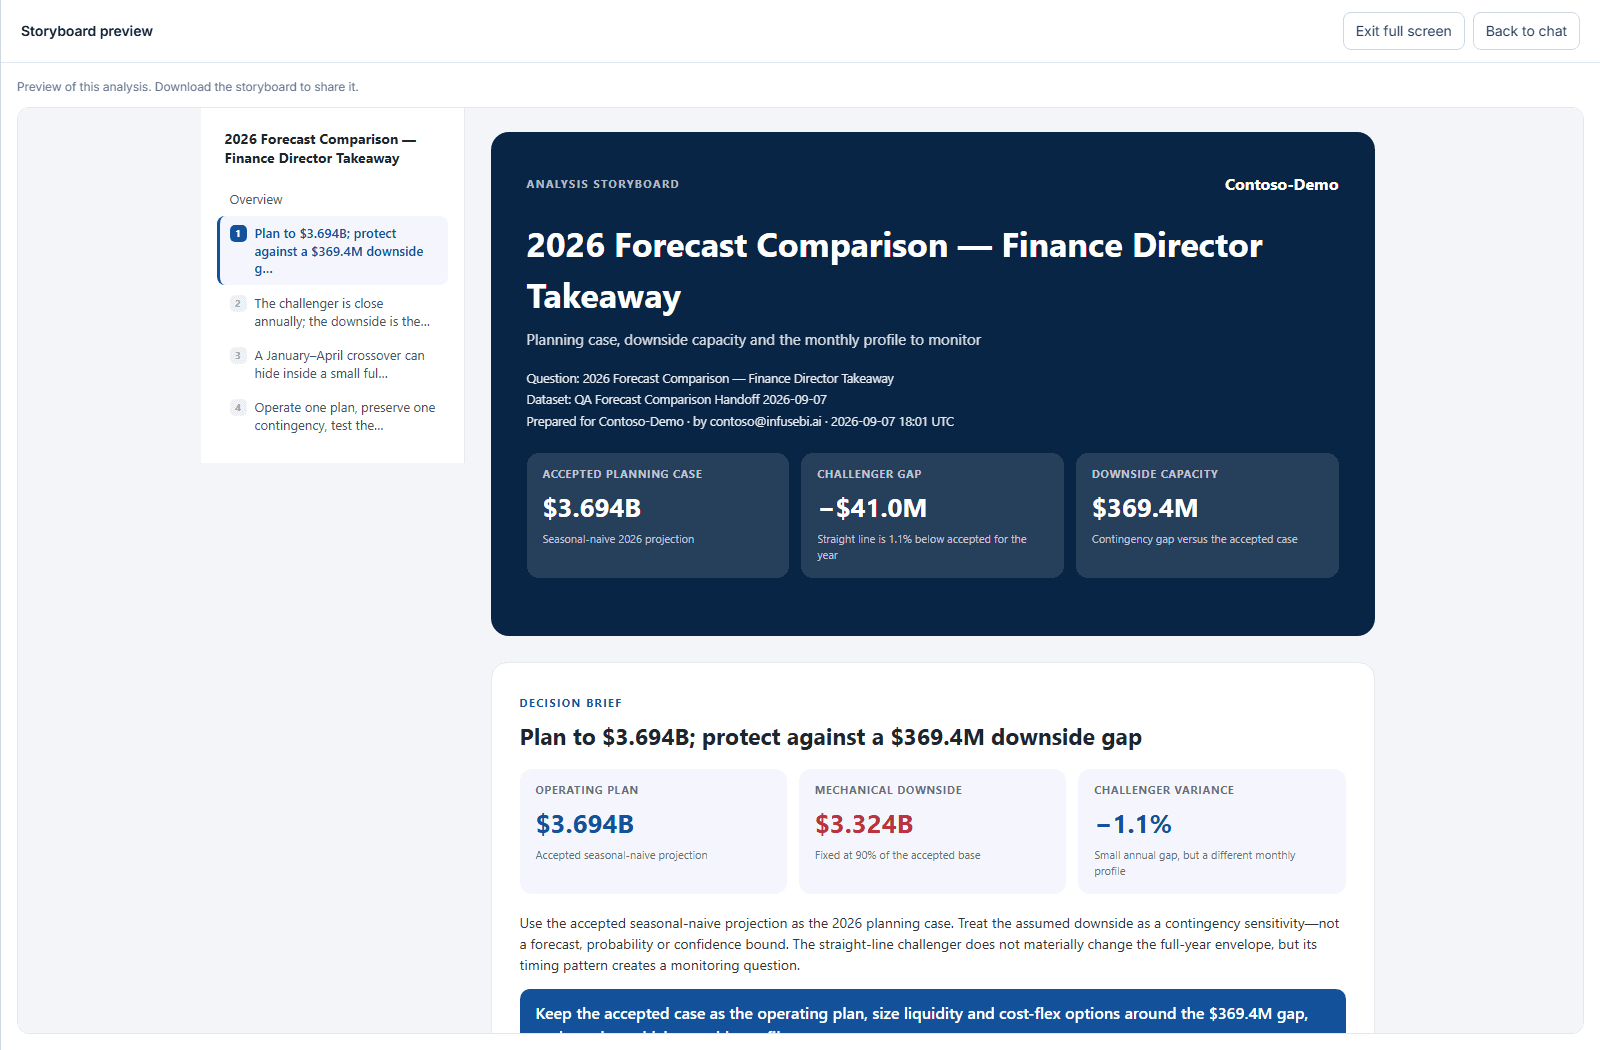
Dashboards, reports, pivots, Excel and PDF exports, and storyboards in PowerPoint, PDF, or interactive HTML.
Learn more about publish - 07Repeat
Approve once, refresh on schedule
Turn a reviewed method into a governed dataset that refreshes on a schedule, with execution history.
Learn more about repeat - 08Embed
Bring it inside your product
Put dashboards, reports, and the AI workspace inside your SaaS app, with each customer isolated to their own data.
Learn more about embed
- 1AI data teamData Modeler, Analyst, Data Scientist, Composer, Dashboard Agent, and Designer
- AnyData sourceTen databases built in. Need another? We add connectors on request.
- 3Storyboard formatsPowerPoint, PDF, and interactive HTML
- 1Permission modelShared by dashboards, exports, and AI answers


Try it yourself
Pick a business question. Watch the work happen.
Four prepared examples show how a question becomes findings, a method you can check, and a dataset you can download.
A forecast you can plan around.
The example projects steady growth through September. Use the range around the forecast to plan inventory, rather than treating a single number as a promise.
A guided illustration, not live AI. Questions stay in your browser and select a prepared example. Results use synthetic data.
Built for business questions
What do you want to know about your business?
Start with the decision you need to make. InfuseBI helps you work through the data behind it.
Understand performance
Why did revenue fall? Which products, regions, or customers contributed most to the change?
Plan with more confidence
What might demand look like next quarter? How much uncertainty should our plan allow for?
Know where to focus
Which customer groups behave differently? Which costs deserve a closer look?
Explore the connected view
One dashboard. Several ways to understand the business.
Choose a region or a state. See revenue, product mix, and market performance update together.
See the whole business. Then zoom in.
Inside InfuseBI
See your AI data team at work.
01 Ask Copilot
A leadership review, written from your data.
A takeaway, the comparison table, and the steps the Analyst took — ready to question or refine.
See how it works →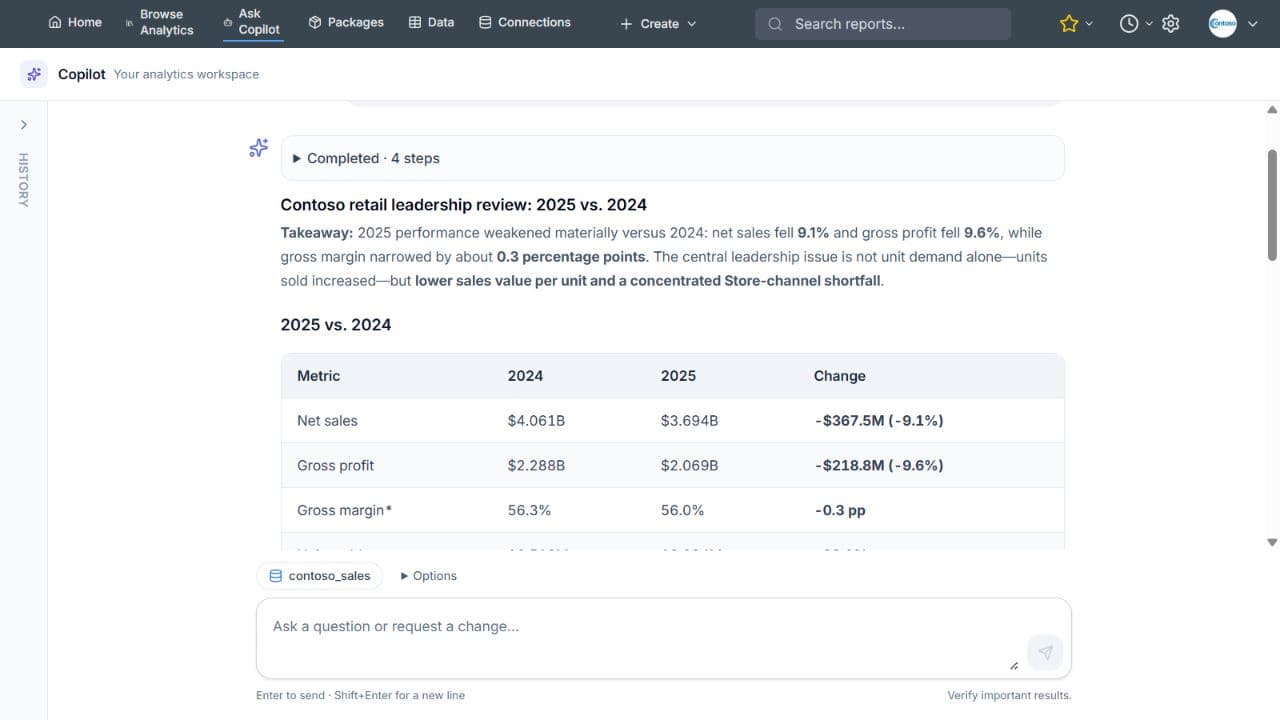
02 Dashboard Agent
A whole dashboard from one prompt.
KPIs, charts, and tables drafted together from governed data. Review it, adjust it, then publish.
See how it works →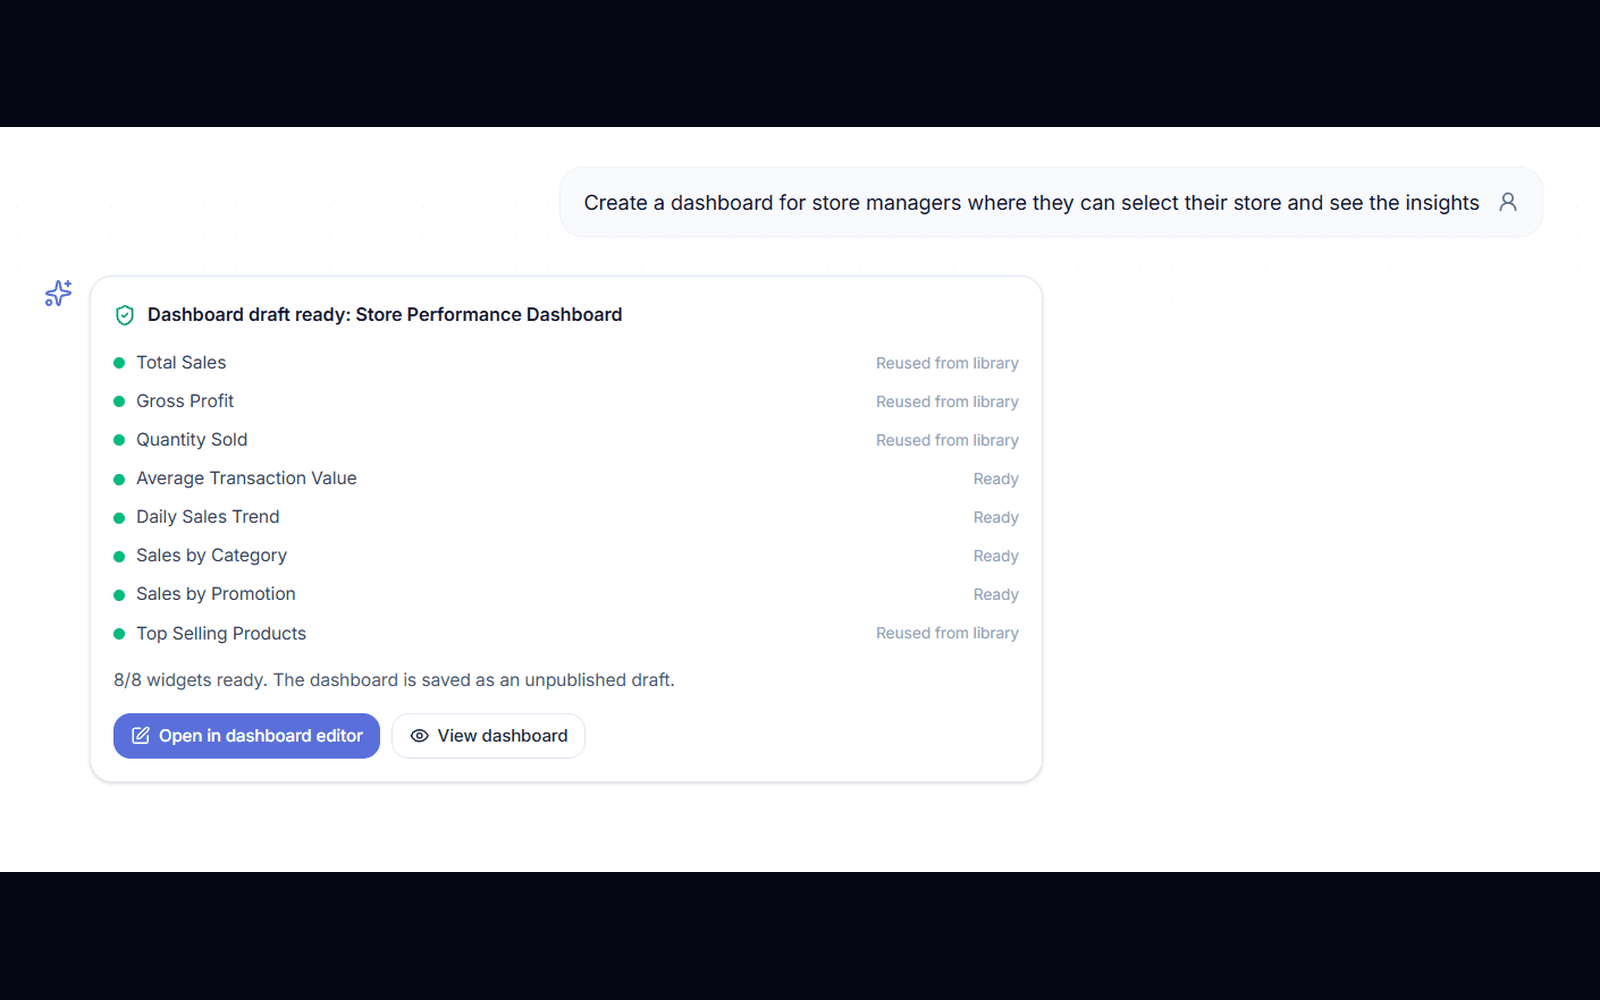
03 Data Scientist
Forecasts you can challenge before you trust.
Compare an accepted model with a simpler challenger, inspect the approach, and rerun with revisions.
See how it works →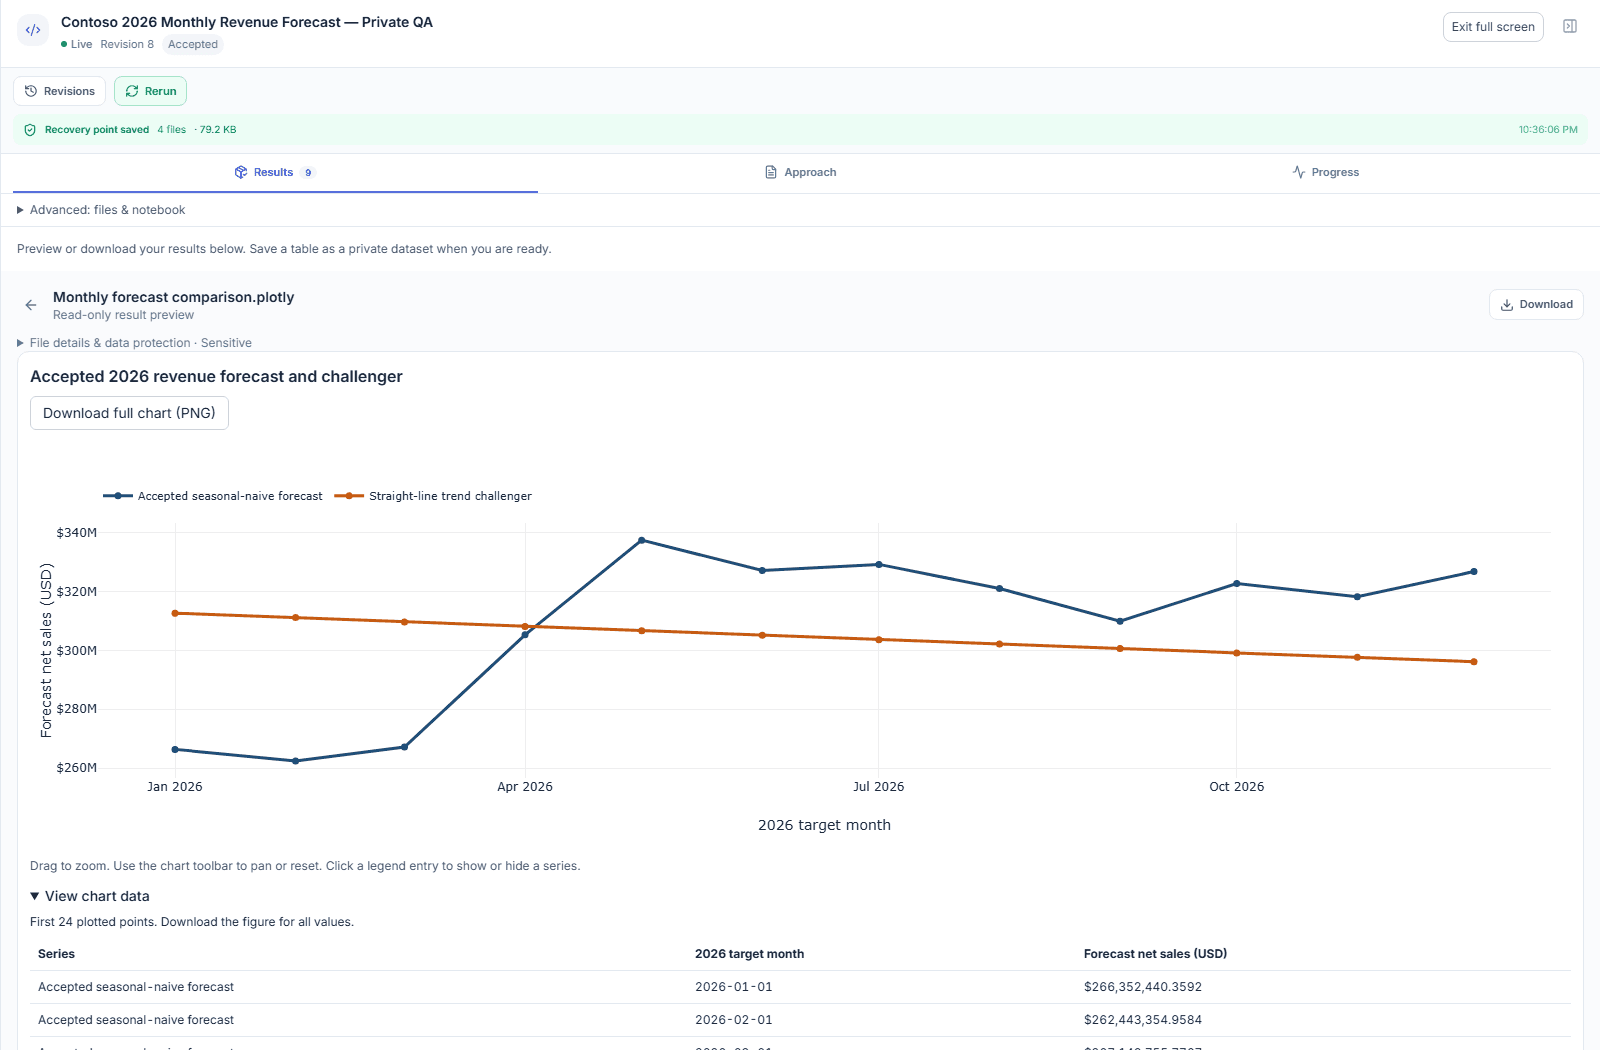
04 Results
Prepared results, one click from a dataset.
Preview the output, download it to Excel, or save it as a governed dataset for reporting.
See how it works →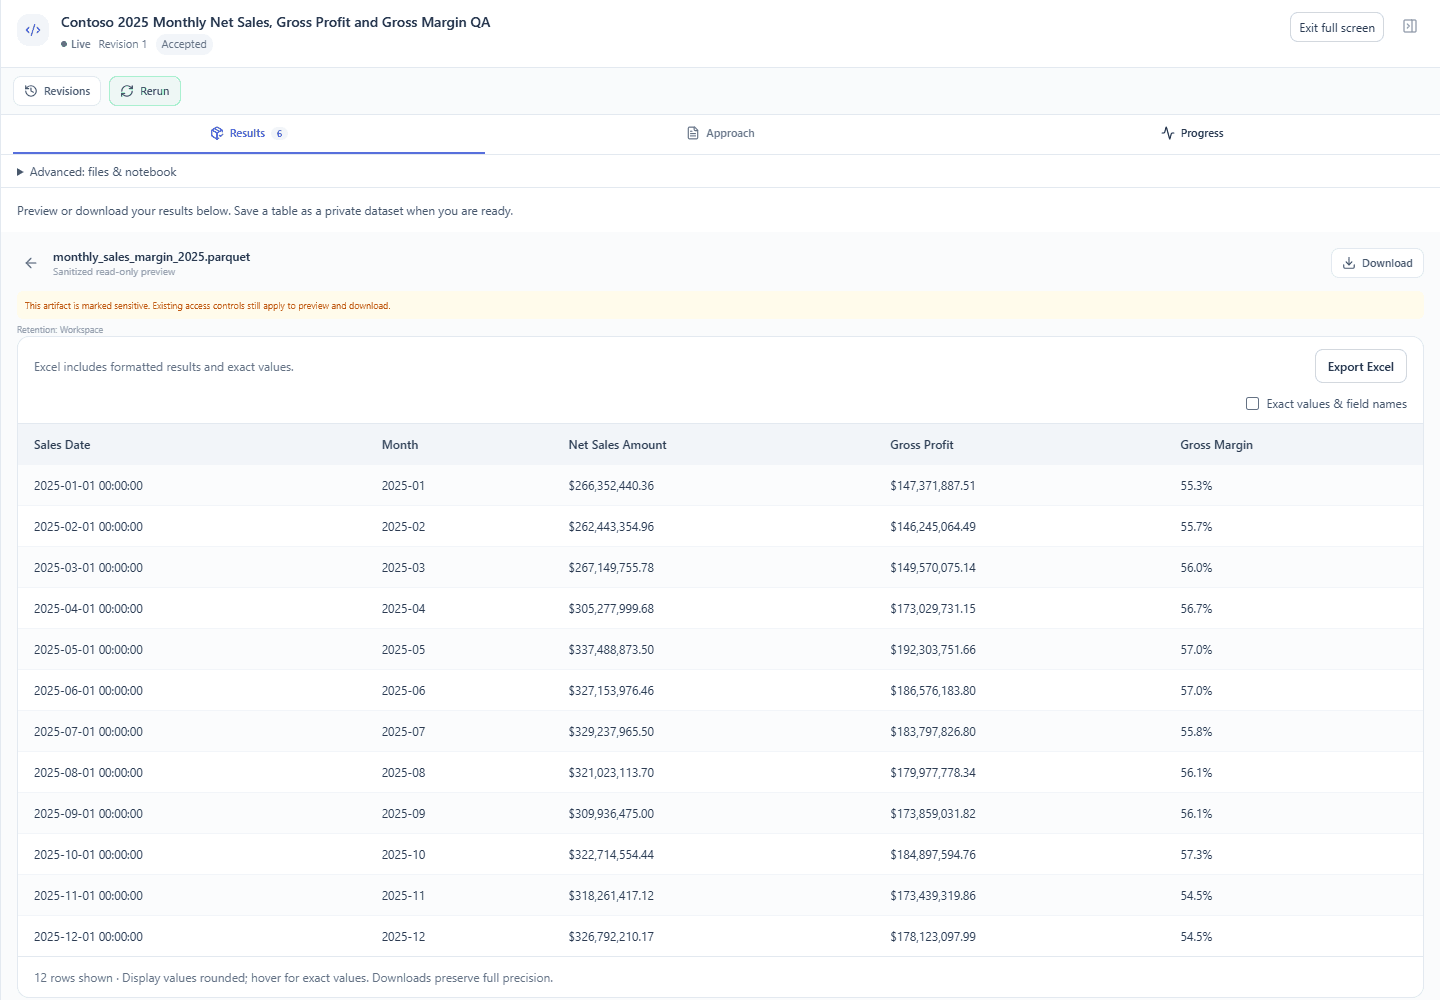
05 Governance
Access decided once, applied everywhere.
Dataset permissions, row-level security, and AI field controls follow the data into every answer.
See how it works →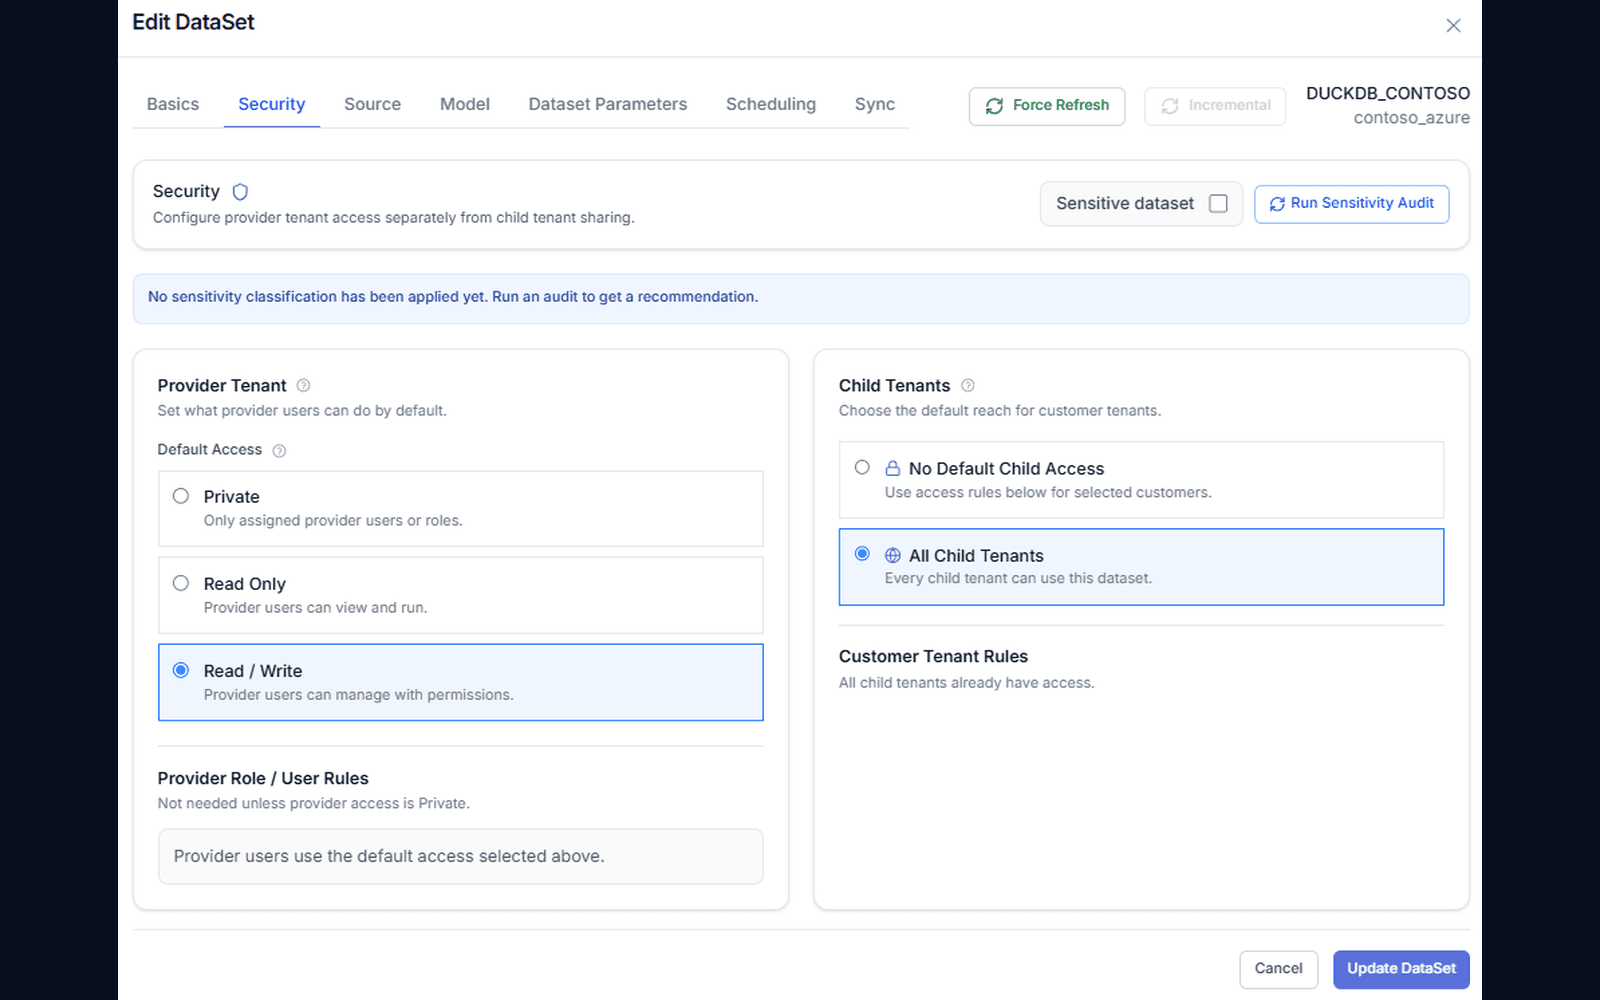
Something your team can use
Turn your findings into reports and dashboards.
Share clear charts and explanations with your team. Keep the analysis so you can review it and answer follow-up questions.
- ✓Clear explanations and charts for business decisions
- ✓Shareable reports, presentations, and dashboards
- ✓Saved analysis you can inspect, refine, and repeat
Built for your business
Your data. Your permissions. Your decision.
Connect business data or upload a file. Control access, review the evidence, and decide when a result is ready to share.
Use the data you already have
Work with connected databases and uploaded files. Your team’s business definitions give the analysis context.
Keep access under control
Permissions and data controls govern available inputs. Review changes before publishing or scheduling them.
Keep your reporting connected
Use the results in InfuseBI reports, dashboards, and customer experiences alongside your existing analytics.
Ready when you are
Bring your toughest question.
See how your AI data team turns it into findings, dashboards, and data your team can use.
FAQ
Frequently asked questions
Who is on the InfuseBI AI data team?+
The Data Modeler, Analyst, Data Scientist, Composer, Dashboard Agent, and Designer. The Data Modeler builds datasets from your tables, the Analyst explains what changed, the Data Scientist forecasts and models, the Composer creates charts, pivots, and reports, the Dashboard Agent drafts full dashboards, and the Designer restyles them. They all work on your governed data, inside your permissions.
How is it different from asking for a chart?+
A chart describes a view of the data. A data science task can prepare new data, test an analytical approach, compare models, and produce reusable results. The analyst helps translate the findings into business explanations and visualizations.
Can I inspect and refine the work?+
Yes. You can review the analysis, its notebook and outputs, and request a follow-up revision. Check assumptions and validation before relying on a model or publishing the result.
Can an analysis become a dataset or run on a schedule?+
Yes. Authorized users can publish results as new datasets or review changes to existing datasets. Approved analysis methods can be configured for recurring refresh, with permission checks and execution history.
Do I need SQL to prepare data for analysis?+
No. Pick your tables and AI links them, names the fields, and suggests the measures. The dataset is checked before it is published, and updates to live datasets show which reports change first.
Is the interactive example running on my data?+
No. The website walkthrough uses prepared, synthetic examples and does not call a live AI model. Your question stays in your browser and selects a sample scenario. Request a demo to discuss your own data and workflow.
Do we still get dashboards, reports, and embedded analytics?+
Yes. Your AI data team works inside InfuseBI’s governed analytics platform, alongside dashboards, reports, pivots, exports, customer workspaces, and embedding.